Evaluation and Test
Flight Testing
Testing our airplane through full-scale flight testing was an integral component of our project. Since we were based on Penn's campus in Philadelphia, we didn't have much room to fly around campus (too many buildings, people, etc...). However, just north of us along the Schuylkill river are some nice park areas that are a part of Fairmount Park. West Fairmount Park has open fields and baseball diamonds, which were perfect for our purposes and not too far away. On several occasions we saw others flying RC airplanes and enjoyed talking to them about their planes. The majority of our tests took place at sunrise (wind conditions are often more ideal earlier in the morning) and would last for several hours depending on our testing plans, weather, and severity of crash damage. See the Picture and Video galleries for more info about our flight tests.
Flight Dynamics: Model Validation
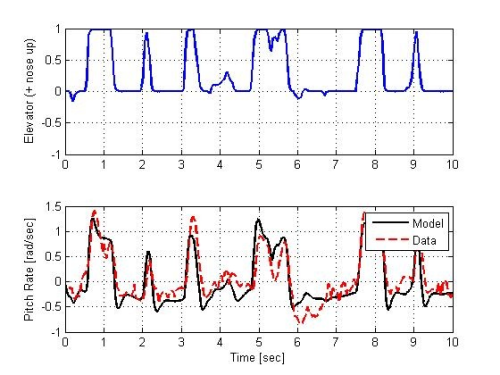
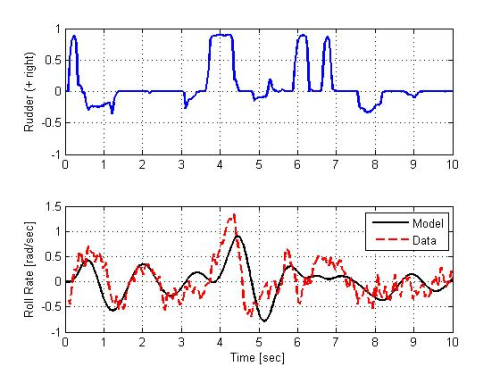
Before using the plane dynamics model to choose gain values and settle on our controls scheme, validation of the theory through comparison with test data was necessary. The plots on the right show actual elevator and rudder input from ten seconds of a test flight. The red and black lines compare the actual pitch and roll rates measured by the plane's gyroscopes to the plane's reactions as predicted by the model.
It is clear that the model predicts the pitch response of the aircraft very well. The model does not correlate exactly with every feature of the roll response, but overall the correlation is strong enough for the model to be useful in testing and validating the controls. While elevator is directly correlated to pitch, rudder is typically used to control yaw. More sophisticated aircraft use ailerons to control roll, but since the SuperCub does not have ailerons, rudder is used as a substitute. Therefore, the relationship between rudder and roll is less direct.
After validating the model with several segments of test flight, it was used as an effective way to test different controls schemes and their effects on the plane. Using this model gave insight into the results of tweaking gains or overhauling the architecture without the need for potentially dangerous test flights. This portion of the project was one of the most valuable and has the ability to be adapted for use on large scale UAVs with only minor changes to the motor model and certain physical characteristics of the plane.
Controls Evaluation
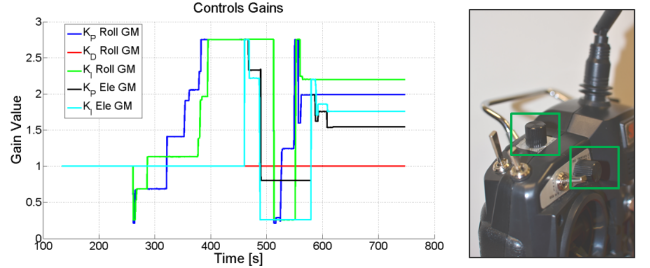
The controls model provided an excellent starting point for estimating gain values. However, since no model is perfectly accurate, it was important to be able to fine-tune these controls gains in real-time flight tests. The dial knobs on our radio controller were used when needed in flight tests to adjust the control gains around their nominal value. The plot to the right shows these gain adjustments during one of our flight tests.
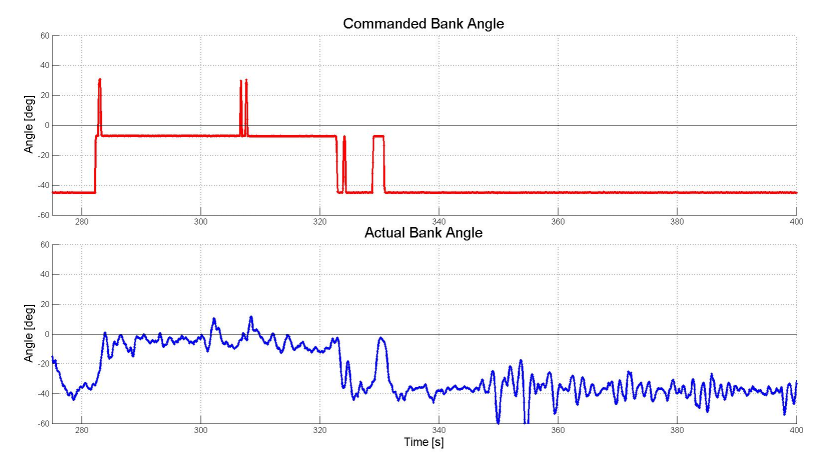
In order to evaluate the success of our controls algorithm, we can observe the difference between the commanded (desired) input and the airplane's resulting motion. In the figure below, the red line shows bank angle commands that were sent to the airplane during one test flight. The blue line shows the actual airplane bank angle that was measured by the on-board sensors. The close match between these two graphs shows that the autonomous rudder PID control algorithm provides satisfactory results in flight.
Software Evaluation
Numerous ground tests were conducted to ensure that software and hardware adjustments were performing as expected without risking the entire system in a flight test. These ground tests were performed on each component and iteration of the system individually. Tests included quantification of GPS position and speed accuracy (running across a known distance outside), testing of orientation, Pitot airspeed (wind tunnel testing), temperature and barometer sensors (taking data at every floor of a high rise of known height), on-board and telemetry logging, navigation, controls and servo deflections, and servo release mechanisms.
